Aucklanders can find out about their local population and the environmental health score of their neighbourhoods, with the 2016 ‘State of Auckland’ report cards now available.
Presented by local board area, the report cards share results from ongoing monitoring and data collection conducted by Auckland Council’s Research and Evaluation unit (RIMU). The localised environmental results follow the release of the 2015 State of Environment report, which assessed the quality of the environment at a regional level.
What are the reports for?
The report cards provide demographic and environmental information at a geographic scale relevant to local communities. They are part of RIMU’s suite of monitoring data publications that tell us about the people in our own communities and how healthy – or not – our local environment is.
RIMU Manager Lucy Baragwanath says, "The report cards provide a way for the public to see the data and information collected for their neighbourhood as part of Auckland Council's statutory obligation under the RMA (Resource Management Act). These reports and the data underlying them help community groups, local boards and the council to make decisions about where they might want to focus community efforts and make improvements.”
“They are also used by students and researchers to get to know about the place they live and the health of their local environment.”
What kind of data is being reported?
The cards report on the health of Auckland’s air, terrestrial biodiversity (the variety of all life on land), soils, freshwater and marine environment. New to the environmental report portfolio this year is a regional card on greenhouse gas emissions. There are also demographic reports covering local population statistics and local business information.
This year, the terrestrial report cards include results from the council’s regional wetland biodiversity monitoring programme, identifying plants and birds as well as any weeds and pest animals found in the survey locations.
What do the environmental scores mean?
Dr Baragwanath says that, “the report grades and changes in them are the result of long-term environmental trends, and there is no quick fix. Ongoing monitoring enables us to understand the health of Auckland’s environment over time, alerts us to possible future issues and provides the critical evidence base for robust decisions leading to better outcomes.”
Grades are mixed across the region. For example, Great Barrier and Little Barrier islands receive the highest biodiversity score due to the level of native plant and bird diversity and the low number of pests. Meanwhile, more urban local boards such as Waitematā, Manurewa, and Devonport-Takapuna have lower scores for their reporting areas as they have less diversity of native plants and birds.
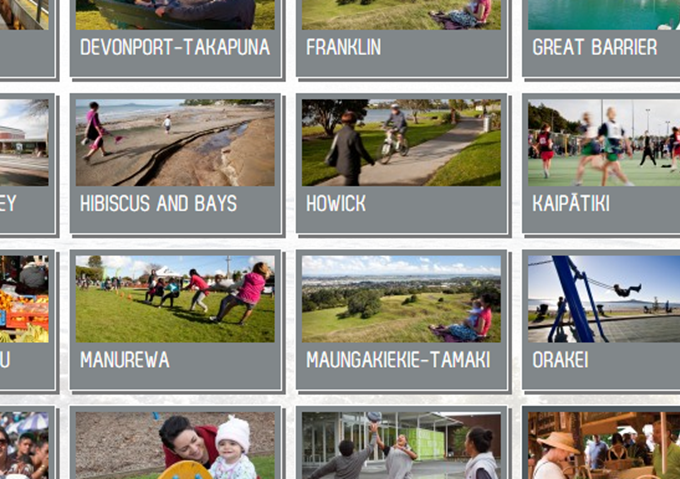
Find your local report cards by visiting stateofauckland.aucklandcouncil.govt.nz and searching by local board area.