
In the vibrant landscape of Tāmaki Makaurau, the air we breathe is far more than a mixture of nitrogen and oxygen. The air sustains the life of our region, and most of the time, it can be characterised as clean in most places. However, the air also carries invisible pollutants from various sources which degrade our air quality.
Our Advantageous Geography
Auckland’s geography is quite unique, which has very significant impacts on how the air moves and the air quality resulting from our daily activities. Positioned between the Manukau and Waitematā harbours, the city exists in a state of constant dialogue with the sea. Sea breezes are the norm and move air to and from the sea nearly every day. Also, as a "remote island nation" in the Pacific, New Zealand is far removed from the transboundary industrial pollution common in places like Europe or Asia. This isolation ensures that our baseline air is among the purest on the planet. The flip side, however, is that most air pollution affecting Aucklanders is generated locally. So, while the harbours provide a source of fresh marine air, it is our activities in the city that give rise to air pollution issues.
The weather patterns of the isthmus serve as the city’s primary "wind engine." Auckland is typically characterized by regular sea-breezes and very frequent strong prevailing westerlies. Sea breezes move urban emissions to and from the shores while the westerlies flush our city’s air. This coastal influence is the primary reason why Auckland’s air is often perceived as high-quality by international standards, however, air quality is not the same everywhere, all the time. In fact, this meteorological engine has a "stall" mode. Under specific conditions, such as cold and calm weather, pollutants don’t go very far and stay close to the ground. In these instances, the city's topography of basins and valleys results in localized spikes in pollution that can linger for hours.
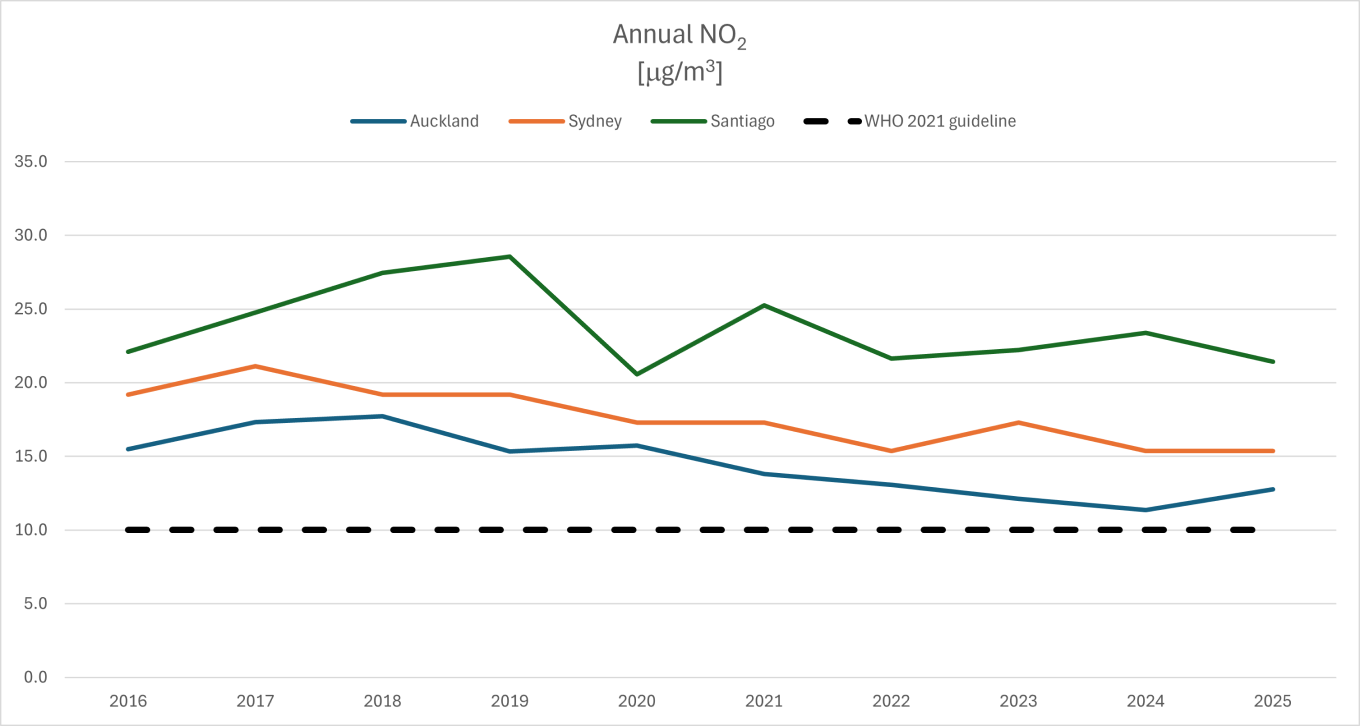
Annual average NO₂ concentration across Auckland, compared with Sydney and Santiago from 2016 to 2025. The data for Santiago was taken from the Parque O’Higgins monitoring site and the data for Sydney is taken from the Earlwood site. (Note the addition of the 2021 WHO guideline, while not a regulatory standard in New Zealand, it is a useful comparator.)
The Emission Profile: Mapping the Seasonal Shift
While geography and meteorology set the physical stage, human activity remains the lead driver of air quality. Also, because our pollution is almost entirely locally generated, we are particularly powerful to affect changes to our air and our actions, from bus electrification to wood burner replacements, have a direct and measurable impact on the air in the city.
The Pollutant Portfolio
To manage our air, we must first understand what we’re dealing with and that means identifying the key pollutants, understanding what their primary sources are and what their regional importance is. The following table synthesizes the core data regarding Auckland’s primary emission sources and their regional characteristics.
|
Pollutant |
Primary Sources |
Key Regional Context |
|
Nitrogen Oxides (NO, NO₂) |
Road Transport |
39% of regional NO and NO₂ emissions are derived from road vehicles. |
|
Fine Particulates (PM₂.₅) |
Domestic Wood Burning |
30% of PM₂.₅ emissions are generated by the residential heating sector. |
|
Sulphur Dioxide (SO₂) |
Shipping & Port Activities |
Emissions are concentrated near the Port of Auckland and Hauraki Gulf. |
|
Coarse Particulates (PM₁₀) |
Construction & Road Dust |
Dust from unsealed roads accounts for 12% of Auckland’s urban PM₁₀. |
|
Ground-level Ozone (O₃) |
Chemical reactions in the atmosphere |
No significant issues observed over the past decade in Auckland. |
Gustavo Olivares Pino.
The Summer/Winter sources
The seasonal profile of Auckland’s air quality follows a distinct "pollution calendar" that moves with human behaviours and weather conditions.
During the warmer summer months, road transport stands as the undisputed primary driver of pollution. While the weather in spring/summer is generally good for dispersion of pollution, our roads are busy and exhaust emissions become the dominant source of air pollution (particularly NO₂ and PM₂.₅). Also, the same windy weather patterns, common in this period, drive an increase of particle emissions from the sea (sea spray) which is more evident in the PM₁₀ concentrations.
As temperatures drop into winter, the pollution profile changes dramatically as wood smoke becomes more relevant as a result of increased domestic heating. Despite the rise of electric alternatives, wood smoke remains a major contributor to winter air degradation.
How are we tracking? Progress and the City Centre Case Study
Looking at long-term trends helps distinguish between overall improvement and locations or pollutants that still require attention. In 2025 Auckland Council produced its 6th State of the Environment report (SOE2025) which documented how air pollution has been changing over the last 10 years. The main observation is that, despite a growing population and vehicle fleet, Auckland’s air quality is on a clear trajectory of improvement for traffic related pollutants. City-wide NO₂ concentrations have declined around 10% year on year for the last decade with improvements significantly higher in the city centre. This "regional victory lap" is the result of long-term strategic shifts in fuel standards, vehicle technology and public transport growth.
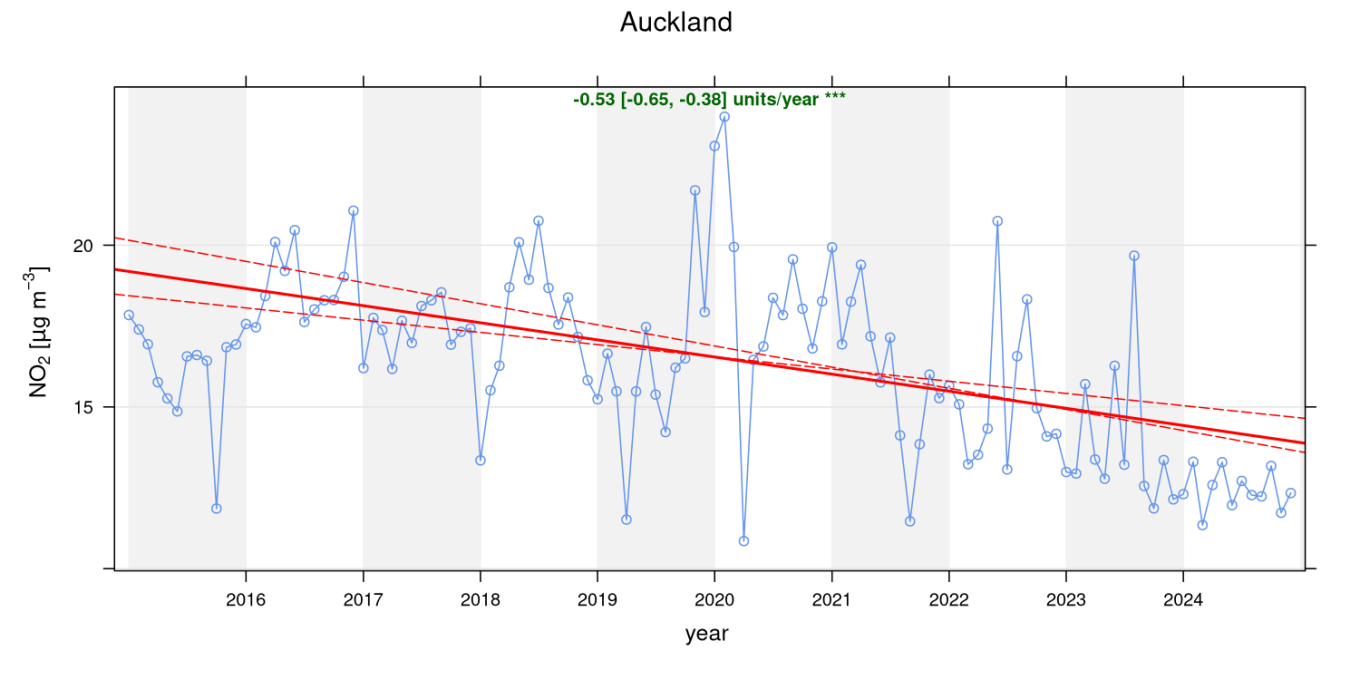
Long term monthly average NO₂ concentrations in the Auckland region. The red line indicates the estimated trend and the blue line corresponds to the monthly averages with the seasonal trend removed. For more details see the 2025 State of the Environment report.
On the other hand, improvements to PM₁₀ and PM₂.₅ concentrations have slowed over the last few years, but still below any standard or guideline.
Case Study: The City Centre Transformation
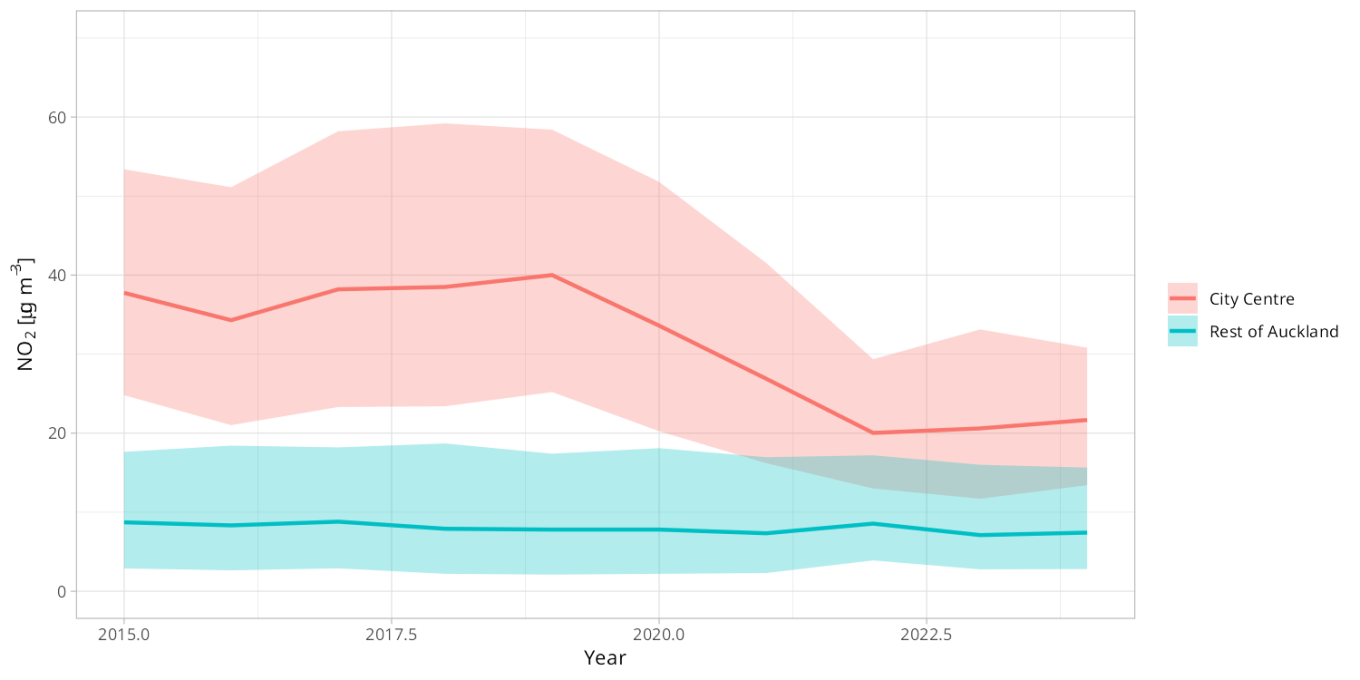
Over the last decade, Auckland’s city centre has seen very significant changes, particularly around the way people travel in the area. The works to complete the CRL and the prioritisation of public transport in the city centre have resulted in measurable improvements in the air quality.
Our State of the Environment report highlights that traffic pollution (NO₂) in the city centre has decreased significantly, particularly over the last 5 years. In fact, NO₂ concentrations measured at our sites in the city centre have decreased by nearly 50% since 2020.
However, we know that air quality can vary significantly in space so in 2025 we started deploying temporary networks of sensors to understand this spatial variation. The first deployment was in the city centre and the results so far indicate that there are areas in where traffic pollution is higher. These findings will help target future monitoring to inform transport and development decisions and ensure air quality is improved for all in Tāmaki Makaurau.
The Climate Change Nexus: New Frontiers of Risk
On top of increased risk of weather events, climate change acts as a "threat multiplier" for air quality, introducing new variables that local policy cannot easily control. In Auckland, the composition of the air we inhale is increasingly dictated by global environmental shifts.
Although we are reasonably far away from any international source, significant events across the Tasman can impact our air quality. Mega-wildfires in Australia have already demonstrated the ability to transport massive plumes of particulate matter across the ocean, and their impact has been observed by our monitoring network. As climate change increases the frequency and severity of wildfires in Australia, these smoke events are projected to become a more frequent feature of the Auckland sky, not only colouring our sunsets but potentially increasing our particulate air pollution.
This increased risk of wildfires also applies to the Auckland region. A study indicated that for Auckland, the average number of high-risk wildfire days could rise from around 8 days per season to over 12 days by 2040, with some models suggesting up to 22 days by 2090.
Additionally, one of the most immediate health risks associated with a warming climate is the rise in pollen levels. Warmer temperatures and higher CO₂ concentrations can enable some plants to produce more pollen for longer periods. In New Zealand, high pollen count days have increased by 75% over the last three decades. This surge directly contributes to allergic rhinitis (hay fever), which already affects up to 40% of the population.
The Hidden Dimensions of Air Quality
"Air quality" encompasses more than just what we inhale; it includes the economic health of the region and the sensory landscape of the city.
The Economic and Social Burden
The true cost of air pollution in Aotearoa is staggering. The latest HAPINZ report estimates that human-made air pollution was associated with 3,239 premature adult deaths or nearly 10% of all deaths in the country. Motor vehicle pollution alone accounted for 2,247 of those deaths (68%). Beyond mortality, pollution was linked to over 1.77 million restricted activity days, where symptoms were severe enough to prevent work or study. All these impacts were estimated to amount to an annual social cost of 15.3 billion. For Auckland, it is estimated that nearly 900 premature deaths are attributable to air pollution and a social cost of more than 5.3 billion.
Additionally, air quality is not distributed equally across the isthmus and vulnerable populations bear a disproportionate burden of the city's emissions:
- Pacific Peoples: The latest Ministry for the Environment’s report Our Air 2024 highlights that while 81% of the general population lives in areas where PM₂.₅ levels exceed WHO guidelines, that figure rises to 94% for Pacific peoples.
- Māori and air quality exposure: Māori are also more likely to live in areas with higher pollution exposure and have, on average, higher rates of underlying respiratory conditions, which leads to an increased sensitivity to air pollution impacts.
- Neighbourhood context and exposure: Communities in more constrained socio-economic circumstances are often located closer to busy transport corridors or industrial zones, leading to higher exposure to air pollution and associated health impacts.
The Path to a Cleaner Tāmaki
The challenges facing Auckland’s air are significant, but because our pollution is largely locally generated, the solutions are within our grasp. We do not need to wait for global treaties to clear the air of the isthmus; we need only to change the way we move and heat our homes within our own boundaries.
What You Can Do
Every Aucklander can contribute to the preservation of the hau (vital essence) of our region:
- Heating: Transition to electric heat pumps. Sales of these units increased by 32% recently, reflecting their popularity as a clean alternative. If you must use wood, ensure it is dry and burned in a modern, well-maintained unit.
- Transport: Support the electrification of the public transport fleet. When replacing a personal vehicle, consider the "long game". The average vehicle stays in the fleet for over 14 years, so choosing a low-emissions vehicle today has a decade-long impact.
- Engagement: Knowledge is the foundation of change. Use the Environment Auckland Data Portal to stay informed about real-time conditions in the region.

Maintaining good air quality across Tāmaki Makaurau requires a strong evidence base, built through monitoring, data, and science, alongside mātauranga Māori and long-standing environmental knowledge. Understanding the impact of air quality on people’s health reinforces why this work matters for communities across the region.
The air of the isthmus is a shared taonga. Protecting it requires consistent effort, informed decision-making, and a long-term commitment to the wellbeing of people and place.
“Manaaki whenua, manaaki tāngata, haere whakamua”.
If we take care of the land and take care of the people, we will take care of the future.
The author
Gustavo Olivares Pino is part of the Environmental Evaluation and Monitoring Unit (EEMU) at Auckland Council who monitor our region’s environment across the air, freshwater water, marine, terrestrial and biodiversity domains. For more information on the work they do, visit the Knowledge Auckland website.
Gustavo comes from Santiago (Chile) where the view of the Andes is often covered by a layer of smog in winter. This motivated him to work in air quality so that "everybody can see their mountains". He has a MSc in Chemical Engineering and more than 25 years of experience working in air quality. Before joining Auckland Council in 2024, Gustavo was part of NIWA's urban air quality and health team.